Our Software Capabilities
Our software platform is designed to support advanced production planning, monitoring, and optimization, with real-time integration across the manufacturing environment.
Key features include:
-
Real-Time Finite Scheduling and Sequencing
Supports both automatic and manual scheduling, with standard real-time interfaces to ERP, MES, and external systems such as Qlip and Nutricontrol. -
Overall Equipment Effectiveness (OEE) Module
A real-time OEE module for tracking and improving equipment performance. -
Statistical Process Control (SPC) Module
Enables real-time monitoring and analysis of process quality metrics. -
Real-Time Flow Screens
Graphical, real-time dashboards provide instant visibility into equipment status and process performance. -
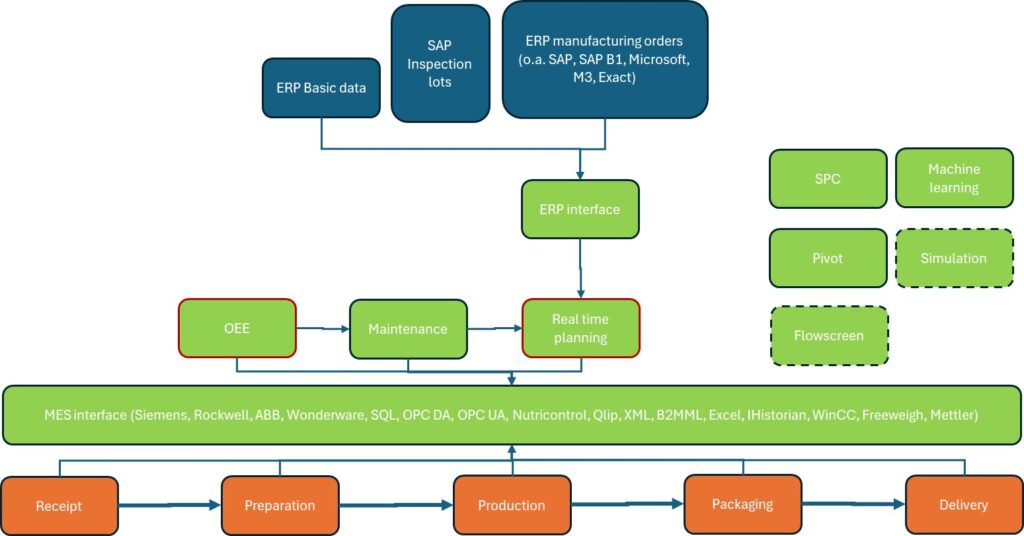
Standard ERP Interfaces
Seamless integration with leading ERP systems, including SAP, SAP Business One, Microsoft Dynamics 365 Business Central, Infor M3, and Exact. -
Standard MES Interfaces
Compatible with MES platforms such as Siemens, Rockwell, ABB, iHistorian, Wonderware, WinCC, and through protocols like OPC UA, OPC DA, XML, and B2MML. -
Laboratory System Interfaces
Standard integrations with lab systems including Qlip and Nutricontrol. -
Technology Stack
Developed using C# Blazor, our software is modern, scalable, and web-based. -
AI & Machine Learning
Incorporates Microsoft Machine Learning for intelligent scheduling, sequencing, and data-driven analysis of process and quality data.
Real-Time Finite Scheduling and Sequencing
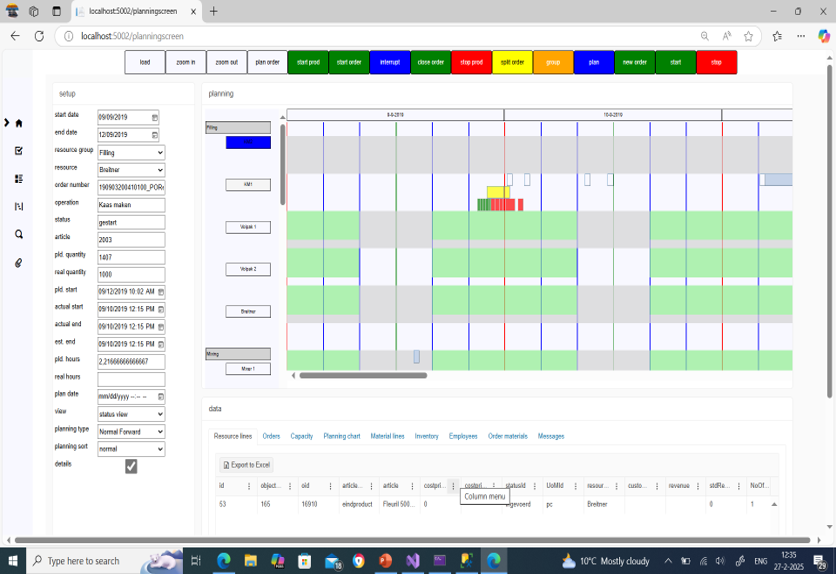
The planning software has comprehensive planning and sequencing capabilities. It supports manual, forward and backward scheduling and bottleneck-based planning approaches. The planning and sequencing are based on Microsoft Machine Learning. The real-time planning can get real-time data from the ERP software and MES software.
It has enhanced planning and sequencing functionality with automatic grouping based on product characteristics, splitting and intelligent planning and sequencing driven by priorities, product characteristics or AI-based logic.
The allocation of orders can be done based on cost optimisation or load balancing.
Each resource has three separate lines for:
- Planned orders based on the planned start and end time of an order.
- Started orders based on the actual start time and replanned end time and completed orders based on the actual start and end time.
- Details about the status of the line in red (downtime) and green (runtime).
Overall Equipment Efficiency (OEE)
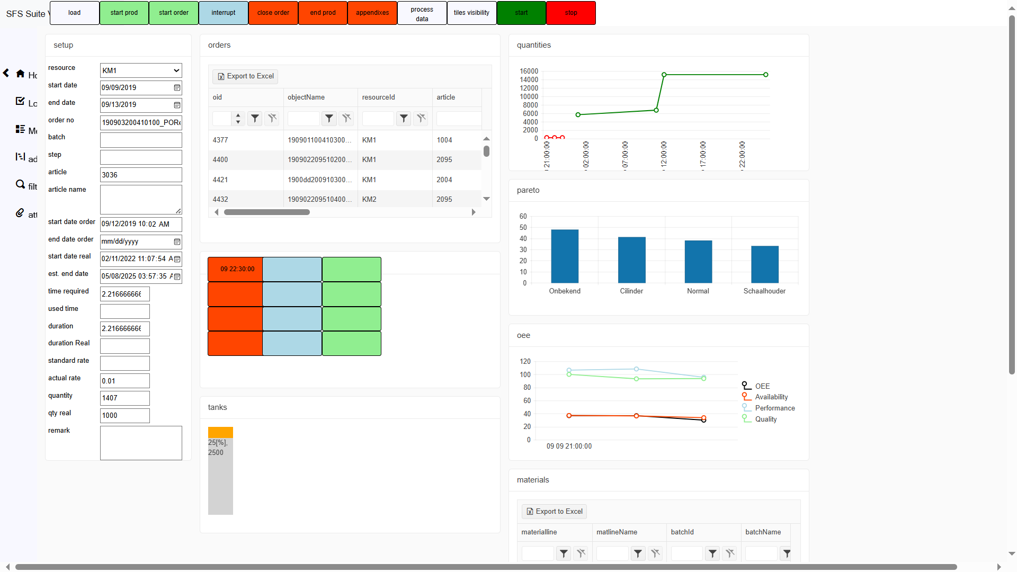
Our modular, real-time dashboard provides comprehensive visibility into production performance and equipment efficiency. It enables operators and managers to make data-driven decisions through an intuitive and flexible interface. The key features are:
- Live OEE Monitoring
Tracks Overall Equipment Effectiveness (OEE) in real time, with visual insights into availability, performance, and quality rate. - Customizable Tile-Based Layout
Modular design allows users to show or hide tiles based on their role or preferences, supporting focused, task-specific views. - Production Insights
- OEE Trends & Performance Metrics
View efficiency trends over time to identify performance degradation or improvement areas. - Order Tracking & Progress
Monitor production orders in real time with actual vs. planned comparisons. - Quantity Analysis
Analyze deviations between actual and planned quantities to pinpoint inefficiencies.
- OEE Trends & Performance Metrics
- Pareto Analysis
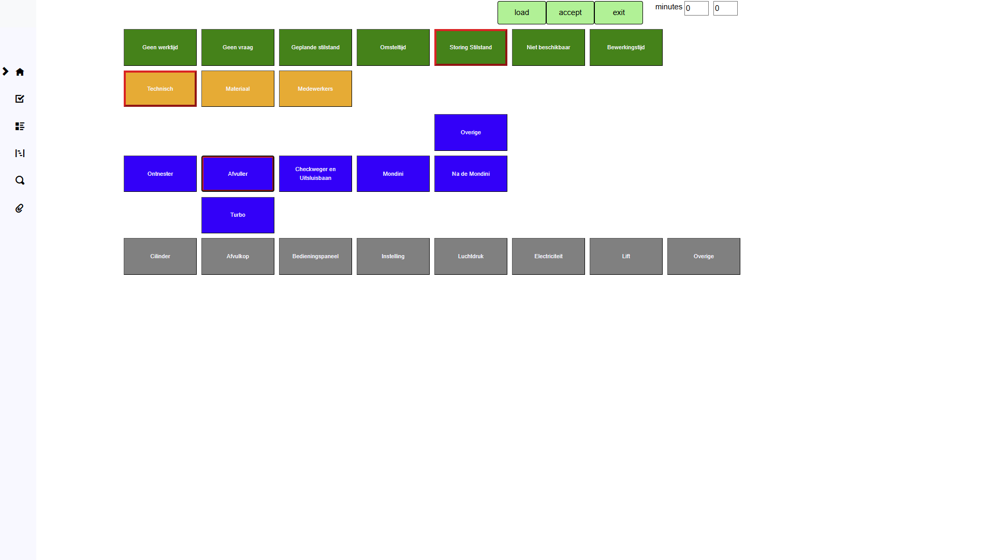
Built-in Pareto insights help prioritize issues based on their frequency and impact. - Interactive Action Buttons
Trigger recommended actions directly from the dashboard related to:- Availability issues
- Performance drops
- Quality rate concerns
- Resource & Material Monitoring
- Tank Level Monitoring
- Material Requirement Indicators
Visual cues for missing or low materials to prevent production delays.
- Gantt Chart Visualization
Interactive Gantt chart for event tracking per resource, showing scheduled, ongoing, and completed operations. - It can also show appendices, like work instructions and process and quality data including the specs.
Statistical Process Control
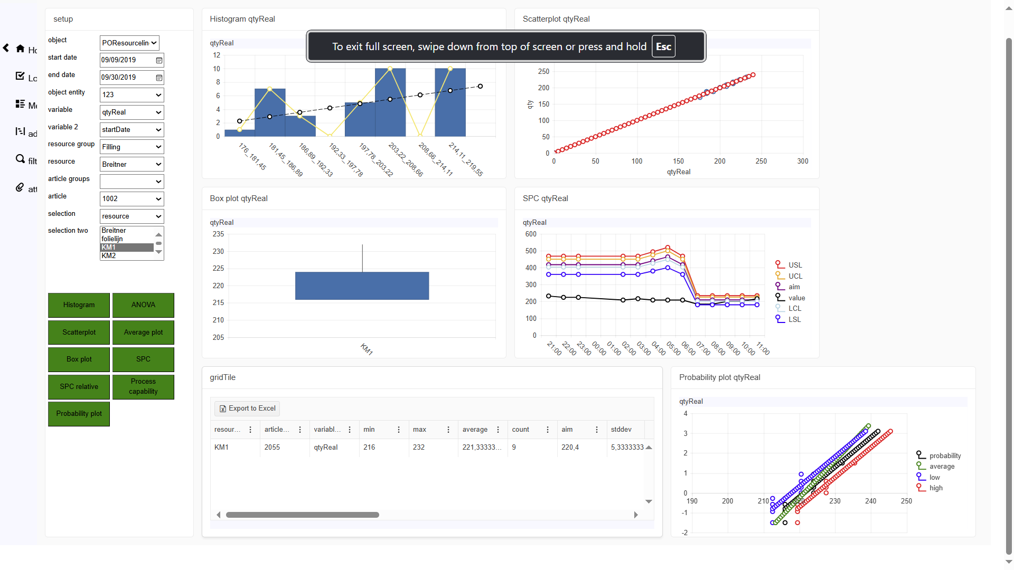
The real time SPC dash boards can show data in the form of histograms, scatter plots, average plots, box plots, SPC data, Anova data, process capability and probability plots.
Data analysis based on statistics and machine learning
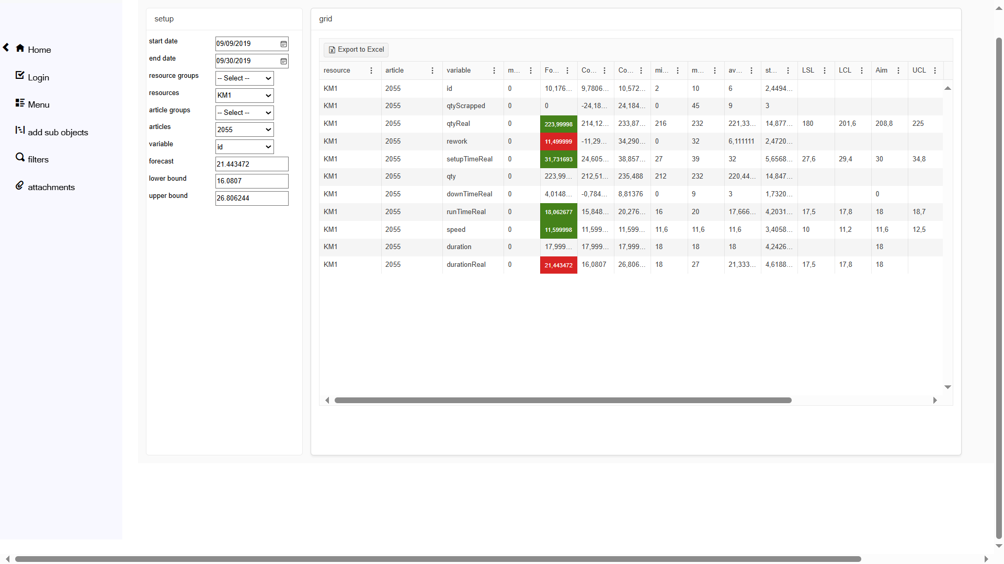
The software gives an analysis of the process and quality variables based on statistical evaluation and on Microsoft Machine learning.